
File:Sine wavelength.svg

Size of this PNG preview of this SVG file: 512 × 356 pixels. Ither resolutions: 320 × 223 pixels | 640 × 445 pixels | 1,024 × 712 pixels | 1,280 × 890 pixels | 2,560 × 1,780 pixels.
Oreeginal file (SVG file, nominallie 512 × 356 pixels, file size: 26 KB)
Ootline
| Descreeption |
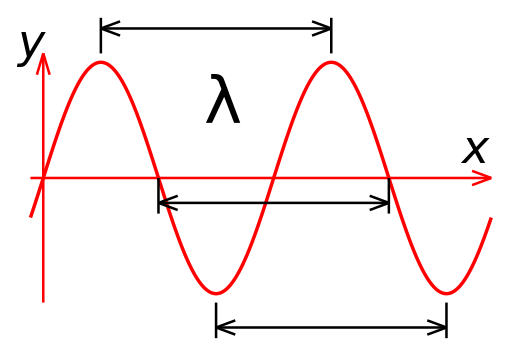
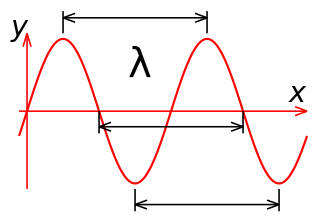
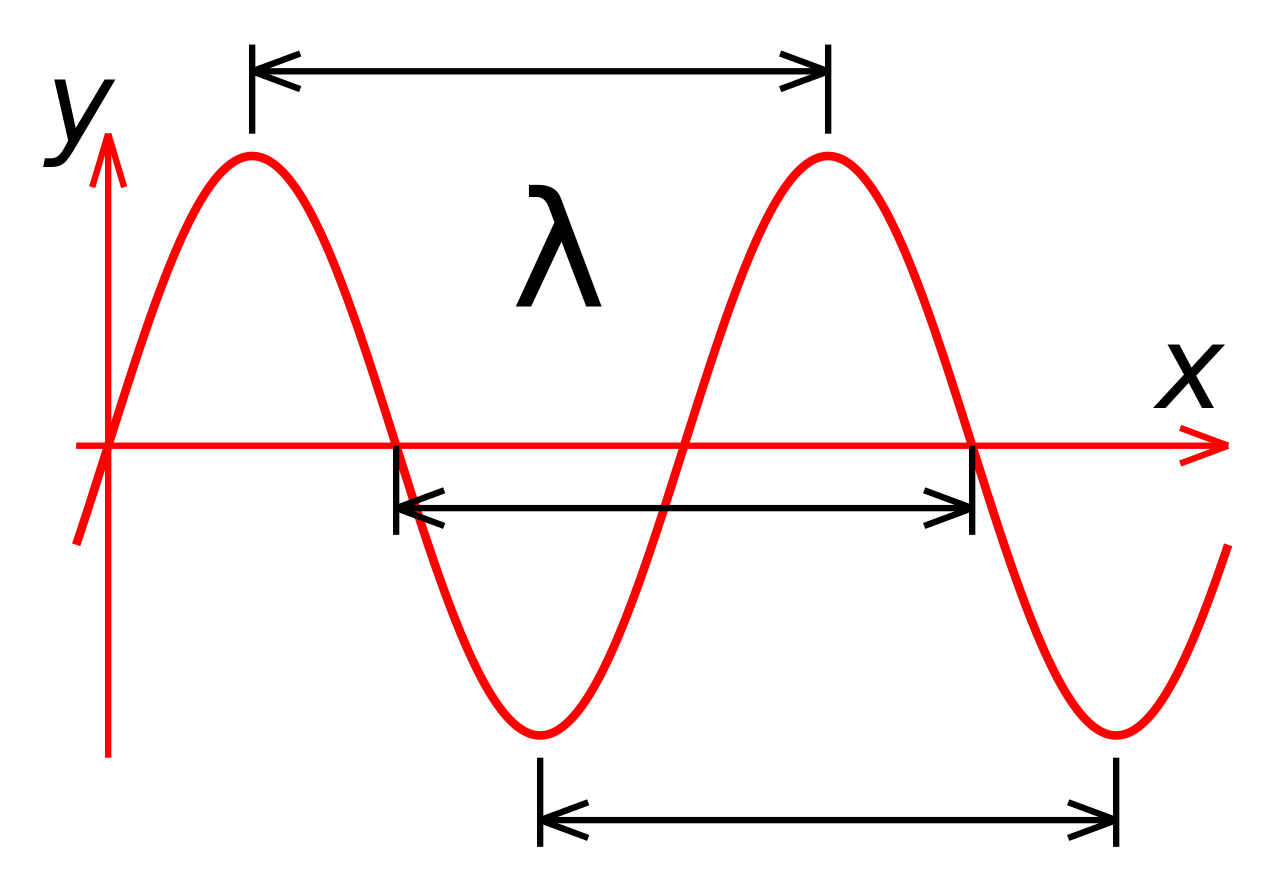
English: Plot of a sine wave, showing three pairs of corresponding points between which wavelength (lambda) can be measured. |
| Date | |
| Soorce | Ain wirk |
| Author | Dicklyon (Richard F. Lyon) |
Licensin
I, the copyright holder of this work, hereby publish it under the following license:
This file is licensed unner the Creative Commons Attribution-Share Alike 3.0 Unported license.
- Ye are free:
- tae share – tae copy, distribute an transmit the wirk
- tae remix – tae adapt the wirk
- Unner the follaein condeetions:
- attribution – Ye must attribute the wirk in the manner specified bi the author or licensor (but nae in ony way that suggests that thay endorse ye or yer uise o the wirk).
- share alik – If ye alter, transform, or big upon this wirk, ye mey distribute the resultin wirk anly unner the same or seemilar license tae this ane.
Source (Asymptote)
import graph;
size(200,100,IgnoreAspect);

real f(real x) {
  return sin(2*pi*x);
}

string fmt(real x) {
  return "";
}

draw(graph(f, 0, 2, operator..), red);
xaxis("$x$",Ticks(N=0,n=4,Step=0.5,ticklabel=fmt));
yaxis("$y(x)$",Ticks(N=0,n=4,Step=1, ticklabel=fmt));

Label lambda=Label("$\lambda$",align=N,blue);
draw(L=lambda, (0.25, 1) -- (1.25, 1), blue, Arrows);
draw(L=lambda, (0.50, 0) -- (1.50, 0), blue, Arrows);
draw(L=lambda, (0.75,-1) -- (1.75,-1), blue, Arrows);
File history
Clap oan ae date/time fer tae see the file aes it kithed at that time.
| Date/Time | Thummnail | Dimensions | Uiser | Comment | |
|---|---|---|---|---|---|
| current | 10:47, 30 October 2021 | | 512 × 356 (26 KB) | Upload77 | Reverted to version as of 06:13, 2 July 2009 (UTC) |
| 21:29, 27 Januar 2014 |  | 600 × 300 (18 KB) | Patrick87 | use generic axes labels (specification of wavelengths on a time or frequency axis as in previous version does not make sense) | |
| 20:54, 5 August 2013 |  | 251 × 125 (25 KB) | Rayhem | Clearer markings, Asymptote source code | |
| 06:13, 2 Julie 2009 |  | 512 × 356 (26 KB) | Dicklyon | {{Information |Description={{en|1=Plot of a sine wave, showing three pairs of corresponding points between which wavelength (lambda) can be measured.}} |Source=Own work by uploader |Author=Dicklyon (Richard F. Lyon) |Date=July 1 2009 |Pe |
Eimage airtins
The'r nae pages airts tae this eimage.
Global file uisage
The follaein ither wikis uise this file:
- Uisage on am.wikipedia.org
- Uisage on ar.wikipedia.org
- Uisage on ary.wikipedia.org
- Uisage on azb.wikipedia.org
- Uisage on az.wikipedia.org
- Uisage on be-tarask.wikipedia.org
- Uisage on be.wikipedia.org
- Uisage on bn.wikipedia.org
- Uisage on cv.wikipedia.org
- Uisage on de.wikipedia.org
- Uisage on en.wikipedia.org
- Uisage on en.wikibooks.org
- Uisage on en.wiktionary.org
- Uisage on es.wikipedia.org
- Uisage on et.wikipedia.org
- Uisage on fi.wiktionary.org
- Uisage on fr.wikipedia.org
- Uisage on gl.wiktionary.org
- Uisage on he.wikipedia.org
- Uisage on he.wikibooks.org
- Uisage on he.wiktionary.org
- Uisage on hr.wikipedia.org
- Uisage on ht.wikipedia.org
- Uisage on hy.wikipedia.org
- Uisage on id.wikipedia.org
- Uisage on ja.wikipedia.org
- Uisage on ka.wikipedia.org
- Uisage on kk.wikipedia.org
- Uisage on ko.wikipedia.org
- Uisage on la.wikipedia.org
- Uisage on lv.wikipedia.org
- Uisage on mk.wikipedia.org
- Uisage on pa.wikipedia.org
- Uisage on pnb.wikipedia.org
- Uisage on ps.wikipedia.org
- Uisage on ru.wikipedia.org
- Uisage on sh.wikipedia.org
- Uisage on si.wikipedia.org
- Uisage on sl.wikipedia.org
- Uisage on so.wikipedia.org
View mair global usage o this file.