
Demografie o Scotland
(Reguidit frae Demografics o Scotland)
The Demography o Scotland is a airticle anent the population o Scotland: the amoont o fowk that bides in Scotland, whit pairt thay bide, whaur thay come fae amang ither things.
The Amoont o fowk that bides in Scotland[eedit | eedit soorce]
Thare 5,295,000 fowk in Scotland, sae faur as the 2011 census says.
| Year | Population |
|---|---|
| 1500 | 500,000 |
| 1600 | 800,000 |
| 1707 | 1,000,000 |
| 1755 | 1,265,380 |
| 1801 | 1,608,420 |
| 1811 | 1,805,864 |
| 1821 | 2,091,521 |
| 1831 | 2,364,386 |
| 1841 | 2,620,184 |
| 1851 | 2,888,742 |
| 1861 | 3,062,294 |
| 1871 | 3,360,018 |
| 1881 | 3,735,578 |
| 1891 | 4,025,647 |
| 1901 | 4,472,103 |
| 1911 | 4,760,904 |
| 1921 | 4,882,407 |
| 1931 | 4,842,989 |
| 1939a | 5,006,700 |
| 1951 | 5,095,969 |
| 1961b | 5,179,000 |
| 1971 | 5,229,000 |
| 1981 | 5,035,000 |
| 1991c | 5,083,000 |
| 2001 | 5,062,000 |
| 2011 | 5,295,000 |
Whit pairt o Scotland fowk bide[eedit | eedit soorce]
| Local Council Area | Population (2001) |
Population (2011) |
% change (2001–11) |
|---|---|---|---|
| Aberdeen City (Aiberdeen) | 212,125 | 222,800 | 5.0 |
| Aberdeenshire | 226,871 | 253,000 | 11.5 |
| Angus | 108,400 | 116,000 | 7.0 |
| Argyll and Bute | 91,306 | 88,200 | −3.4 |
| Clackmannanshire | 48,077 | 51,400 | 7.0 |
| Dumfries and Galloway | 147,765 | 151,300 | 2.4 |
| Dundee City (Dundee) | 145,663 | 147,300 | 1.1 |
| East Ayrshire | 120,235 | 122,700 | 2.1 |
| East Dunbartonshire | 108,243 | 105,000 | −3.0 |
| East Lothian | 90,088 | 99,700 | 10.7 |
| East Renfrewshire | 89,311 | 90,600 | 1.4 |
| City of Edinburgh (Embra) | 448,624 | 476,600 | 6.2 |
| Eilean Siar | 26,502 | 27,700 | 4.5 |
| Falkirk | 145,191 | 156,000 | 7.4 |
| Fife | 349,429 | 365,200 | 4.5 |
| Glasgow City (Glesga) | 577,869 | 593,200 | 2.7 |
| Highland | 208,914 | 232,100 | 11.1 |
| Inverclyde | 84,203 | 81,500 | −3.2 |
| Midlothian | 80,941 | 83,200 | 2.8 |
| Moray | 86,940 | 93,300 | 7.3 |
| North Ayrshire | 135,817 | 138,200 | 1.7 |
| North Lanarkshire | 321,067 | 337,800 | 5.2 |
| Orkney | 19,245 | 21,400 | 10.9 |
| Perth and Kinross | 134,949 | 146,700 | 8.7 |
| Renfrewshire | 172,867 | 174,900 | 1.2 |
| Scottish Borders | 106,764 | 113,900 | 6.7 |
| Shetland | 21,988 | 23,200 | 5.3 |
| South Ayrshire | 112,097 | 112,800 | 0.6 |
| South Lanarkshire | 302,216 | 313,800 | 3.8 |
| Stirling (Stirling) | 86,212 | 90,200 | 4.7 |
| West Dunbartonshire | 93,378 | 90,700 | −2.8 |
| West Lothian | 158,714 | 175,100 | 10.3 |
Whaur fowk in Scotland is fae[eedit | eedit soorce]
| Country of birth | 2001[2] | 2011[3] | ||
|---|---|---|---|---|
| Nummer | % | Nummer | % | |
| 4,410,400 | 87.13% | 4,411,884 | 83.32% | |
| 408,948 | 8.08% | 459,486 | 8.68% | |
| 16,623 | 0.33% | 17,381 | 0.33% | |
| 33,528 | 0.66% | 36,655 | 0.69% | |
| 941 | 0.02% | |||
| 21,774 | 0.43% | 22,952 | 0.43% | |
| Ither Kintras that is Member o the EU | 41,836 | 0.83% | ||
| Ither Kintras Member o the EU (jyned afore 2001) | 59,031 | 1.11% | ||
| Ither Kintras Member o the EU (jyned efter 2001) | 78,254 | 1.48% | ||
| Ither Kintras | 127,926 | 2.53% | 209,760 | 3.96% |
| Total | 5,062,011 | 100.00% | 5,295,403 | 100.00% |
Ethnicity[eedit | eedit soorce]
| Ethnic Group | 2001[4] | 2011[5] | ||
|---|---|---|---|---|
| Number | % | Number | % | |
| White: Scots | 4,459,071 | 88.09% | 4,445,678 | 83.95% |
| White: Ither Breetish | 373,685 | 7.38% | 417,109 | 7.88% |
| White: Erse | 49,428 | 0.98% | 54,090 | 1.02% |
| White: Gypsy/Traiveller[note 1] | 4,212 | 0.08% | ||
| White: Pols[note 2] | 61,201 | 1.16% | ||
| White: Ither | 78,150 | 1.54% | 102,117 | 1.93% |
| White: Tot | 4,960,334 | 97.99% | 5,084,407 |
96.02% |
| Asian, Asian Scottish or Asian British: Indian | 15,037 | 0.30% | 32,706 | 0.62% |
| Asian, Asian Scottish or Asian British: Pakistani | 31,793 | 0.63% | 49,381 | 0.93% |
| Asian, Asian Scottish or Asian British: Bangladeshi | 1,981 | 0.04% | 3,788 | 0.07% |
| Asian, Asian Scottish or Asian British: Chinese | 16,310 | 0.32% | 33,706 | 0.64% |
| Asian, Asian Scottish or Asian Breetish: Asian Other | 6,196 | 0.12% | 21,097 | 0.40% |
| Asie, Asie Scots or Asie Breetish: Tot | 71,317 | 1.41% | 140,678 | 2.66% |
| Black, Black Scots or Black Breetish[note 3] | 6,247 | 0.12% | ||
| African: African, African Scots or African Breetish | 29,186 | 0.55% | ||
| African: Ither African | 452 | 0.01% | ||
| African: Tot | 29,638 |
0.56% | ||
| Caribbean | 3,430 | 0.06% | ||
| Black | 2,380 | 0.04% | ||
| Caribbean or Black: Ither | 730 | 0.01% | ||
| Caribbean or Black: Total | 6,540 | 0.12% | ||
| Mixed or multiple ethnic groups: Tot | 12,764 | 0.25% | 19,815 |
0.37% |
| Ither: Arab[note 4] | 9,366 | 0.18% | ||
| Ither: Ony ither ethnic group | 9,571 | 0.19% | 4,959 | 0.09% |
| Ither: Tot | 9,571 | 0.19% | 14,325 |
0.27% |
| Tot | 5,062,011 | 100.00% | 5,295,403 |
100.00% |
- ↑ New category created for the 2011 census
- ↑ New category created for the 2011 census
- ↑ Category restructured for the 2011 census
- ↑ New category created for the 2011 census
Leids[eedit | eedit soorce]
| Ability | Scots | Scottish Gaelic | ||
|---|---|---|---|---|
| Usual residents aged 3+ | Proportion | Usual residents aged 3+ | Proportion | |
| Unnerstauns but disna speak, read or write | 267,412 | 5.22% | 23,357 | 0.46% |
| Speaks, reads an writes | 1,225,622 | 23.95% | 32,191 | 0.63% |
| Spiks but disna read or write | 179,295 | 3.50% | 18,966 | 0.37% |
| Spiks an reads but disna write | 132,709 | 2.59% | 6,218 | 0.12% |
| Reads but disna spik or write | 107,025 | 2.09% | 4,646 | 0.09% |
| Ither combination o airts | 17,381 | 0.34% | 1,678 | 0.03% |
| Nae airts | 3,188,779 | 62.30% | 5,031,167 | 98.30% |
| Tot | 5,118,223 | 100.00% | 5,118,223 | 100.00% |
| Can spik | 1,541,693 | 30.12% | 57,602 | 1.13% |
| Haes some ability | 1,929,444 | 37.70% | 87,056 | 1.70% |
Distribution o thaim that stated they could spik a local leid in the 2011 census.
-
 Scots
Scots -
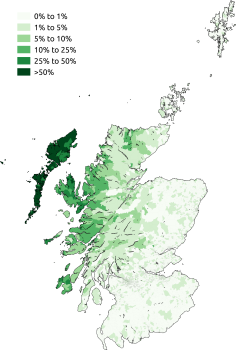 Scottish Gaelic


Ither leids in Scotland include Polish, that is spaken by naur ae percent o the kintra.
Releegion[eedit | eedit soorce]
| Current religion | 2001[6] | 2011[7] | ||
|---|---|---|---|---|
| Nummer | % | Nummer | % | |
| Kirk o Scotland | 2,146,251 | 42.4 | 1,717,871 | 32.4 |
| Roman Catholic | 803,732 | 15.9 | 841,053 | 15.9 |
| Other Christian | 344,562 | 6.8 | 291,275 | 5.5 |
| Total Christian | 3,294,545 | 65.1 | 2,850,199 | 53.8 |
| Islam | 42,557 | 0.8 | 76,737 | 1.4 |
| Hinduism | 5,564 | 0.1 | 16,379 | 0.3 |
| Buddhism | 6,830 | 0.1 | 12,795 | 0.2 |
| Sikhism | 6,572 | 0.1 | 9,055 | 0.2 |
| Judaism | 6,448 | 0.1 | 5,887 | 0.1 |
| Ither releegion | 26,974 | 0.5 | 15,196 | 0.3 |
| Nae releegion | 1,394,460 | 27.6 | 1,941,116 | 36.7 |
| Releegion no gien | 278,061 | 5.5 | 368,039 | 7.0 |
| Nae releegion/No gien tot | 1,672,521 | 33.0 | 2,309,155 | 43.6 |
| Total population | 5,062,011 | 100.0 | 5,295,403 | 100.0 |
References[eedit | eedit soorce]
- ↑ http://www.scotlandscensus.gov.uk/documents/censusresults/release1b/rel1bsb.pdf 2011 Census: First Results on Population and Household Estimates for Scotland Census day usually resident population by council area, 2001 and 2011; ], Accessed 22 March 2013
- ↑ 2001 Census for Scotland scrol analyser Archived 2014-09-24 at the Wayback Machine, Accessed 6 September 2014
- ↑ 2011 Census for Scotland Standard Outputs, Accessed 5 September 2014
- ↑ "Analysis of Ethnicity in the 2001 Census - Summary Report". Retrieved 6 September 2014.
- ↑ "Scotland's Census 2011 - Standard Outputs". Retrieved 6 September 2014.
- ↑ "Analysis of Religion in the 2001 Census". The Scottish Government. 17 Mey 2006. Archived frae the original on 6 Juin 2011. Retrieved 18 Januar 2016.
- ↑ "Scotland's Census 2011 – Table KS209SCb" (PDF). scotlandscensus.gov.uk. Retrieved 26 September 2013.